Graph Preset
Where graphs become a chart. A preset is a set of saved chart parameters: the period, the chart type (columns, lines, areas), the palette and the list of indicators. Open a preset, press "Build" — and watch income and expenses march month by month.
Where to find it: Modules → Nominal Ledger → Registers → Graph Preset
Walkthrough
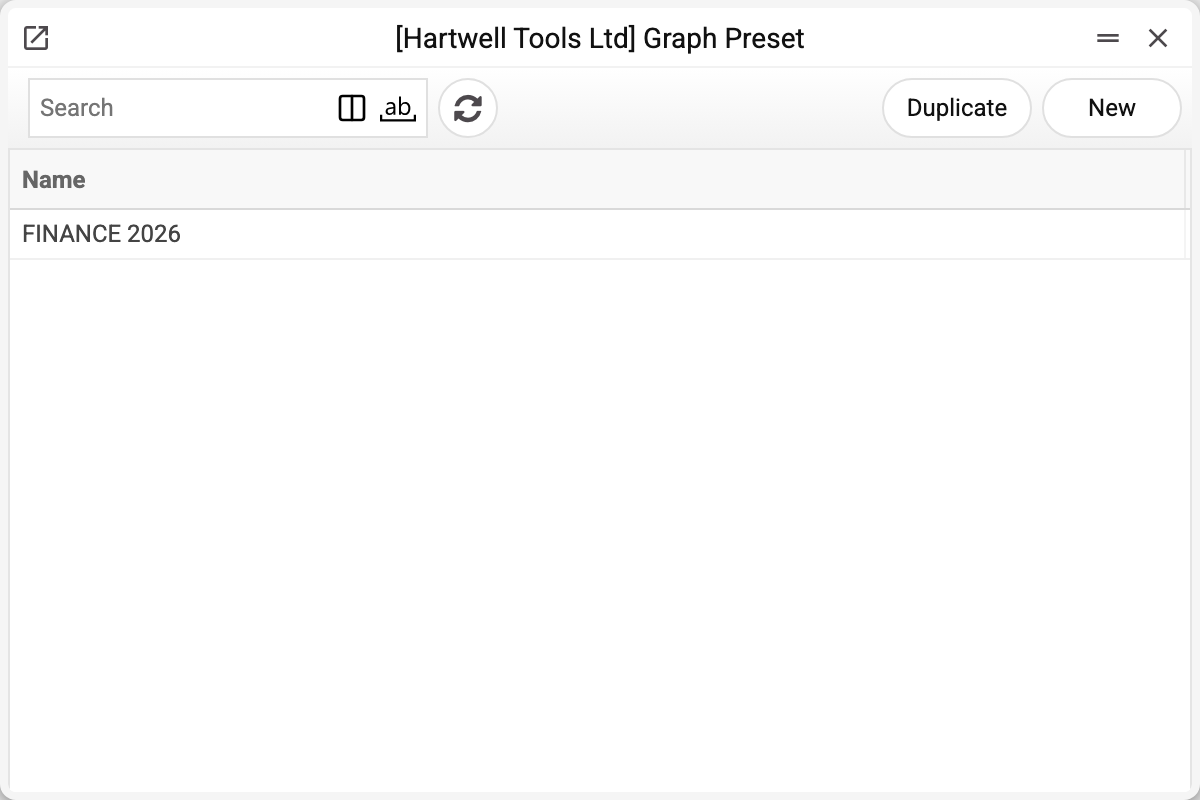
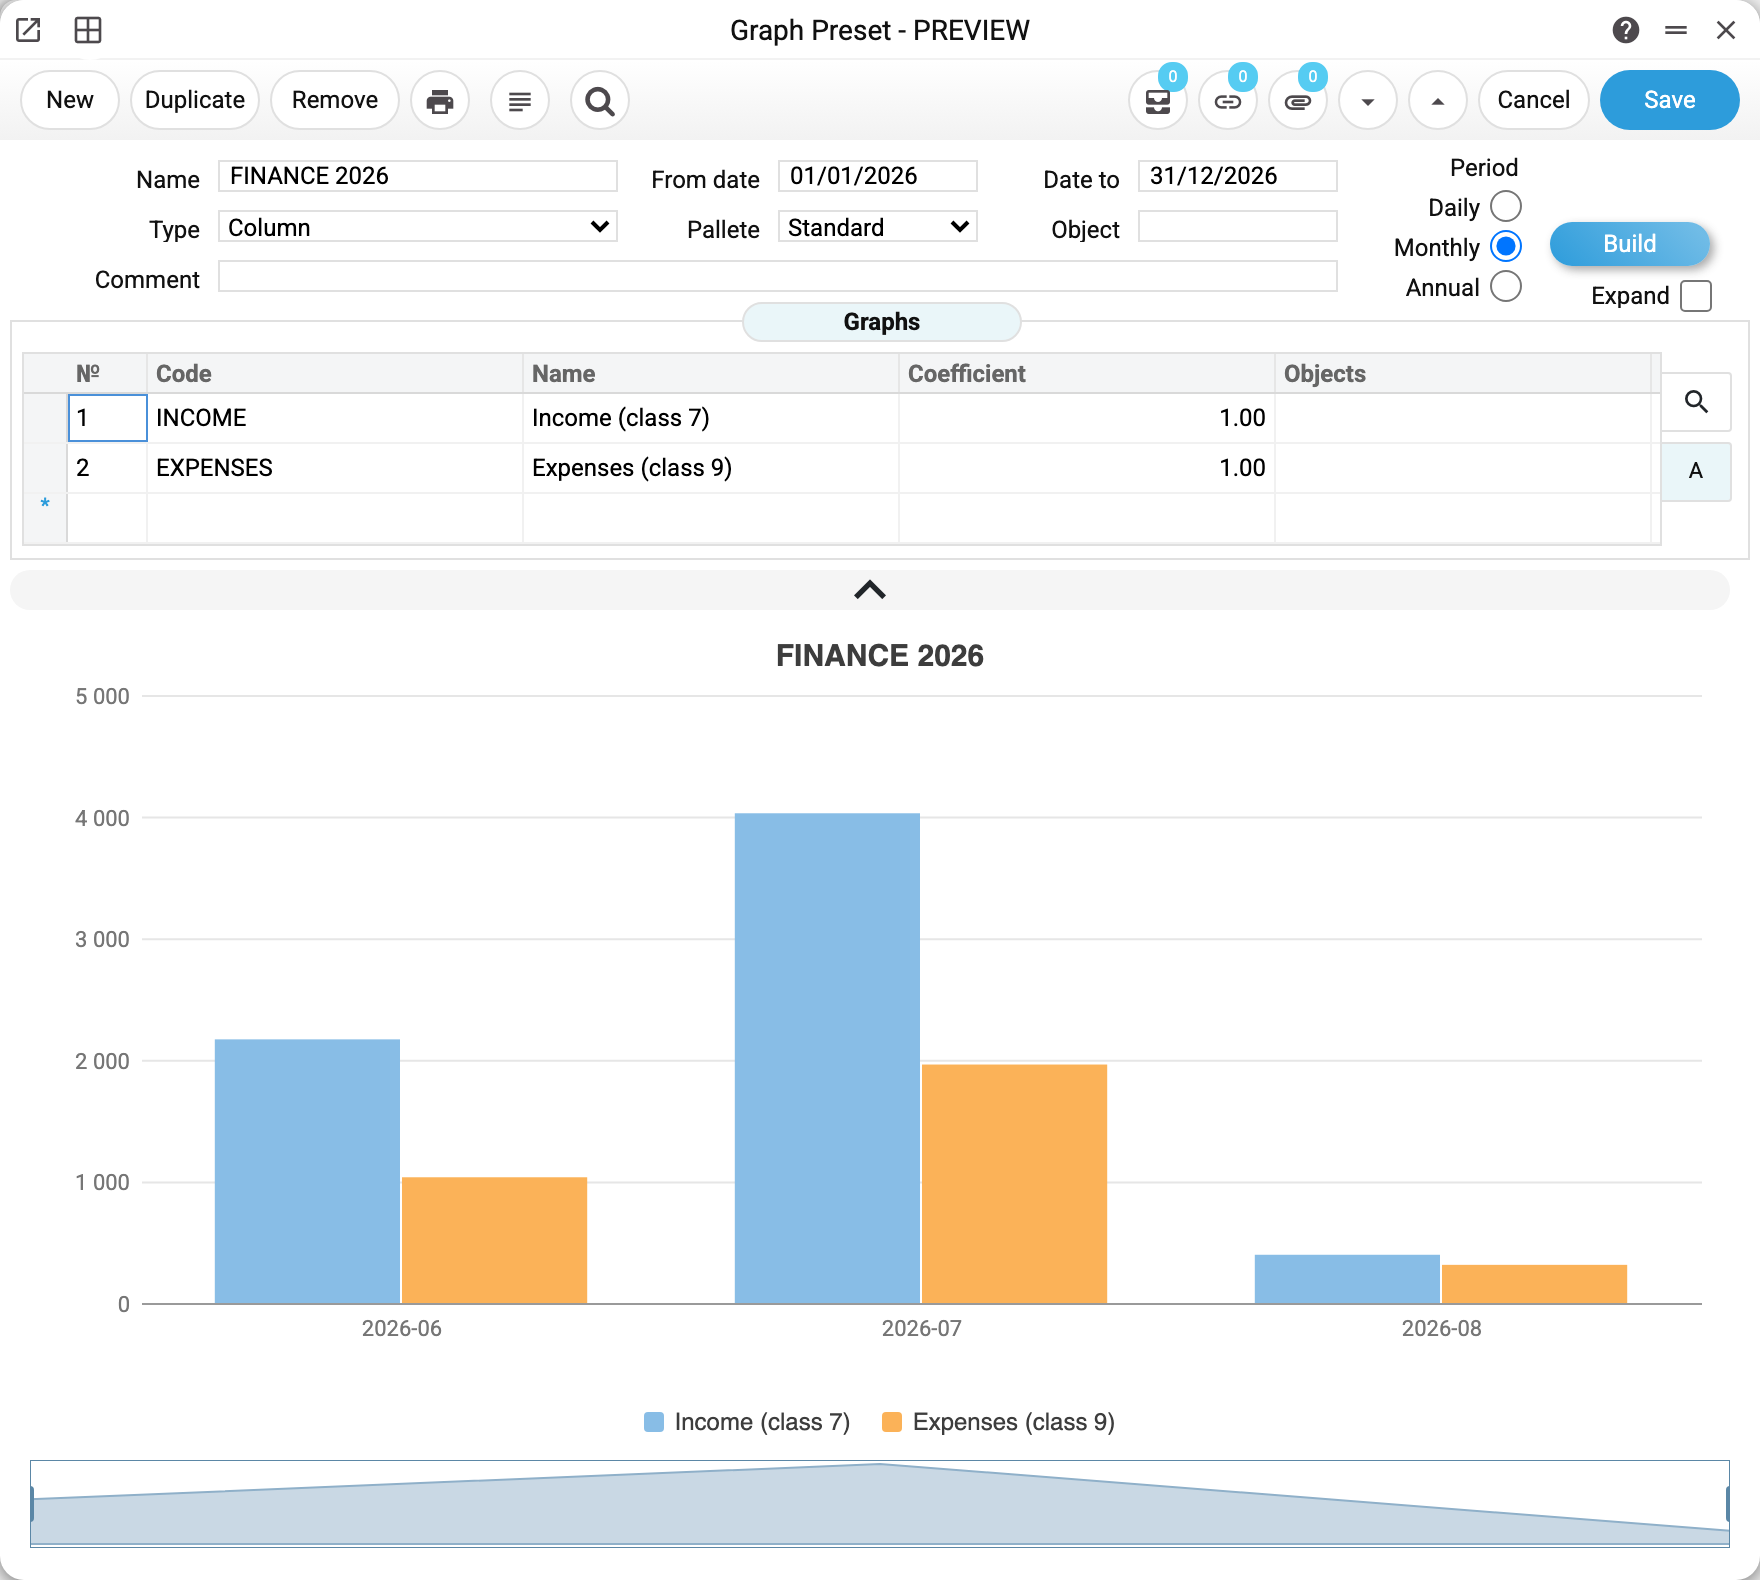
The demo's FINANCE 2026 preset: year 2026 ("From date" — "Date to"), type Column, monthly period, and two indicators in the matrix — INCOME and EXPENSES with coefficient 1. The "Build" button draws the chart right inside the window: column pairs by month, the June–July peak obvious at a glance, income above expenses in every month. Note that months without a single posting are simply skipped on the axis, not shown as zeros.
Header fields:
- Name — the unique preset name;
- Type — chart look: Column, Area, Line, Spline and their variants LineSymbols, SplineArea, SplineSymbols;
- From date / Date to — the selection period, but only Daily takes it exactly: Monthly widens it to whole calendar years (from 1 January of the "From date" year to 31 December of the "Date to" year), and with Annual the dates do not limit the postings — every year is shown;
- Period — the axis step: Daily / Monthly / Annual;
- Palette — the colour scheme (Standard, Dark, Light…);
- Object — an analytics filter for the whole preset: only postings tagged with this object are counted, as long as neither the graphs nor the preset rows set objects. Otherwise all the objects are merged into one list and a posting counts when it has any of them — together with the other filters "Object" widens the selection instead of narrowing it;
- Expand — instead of indicator series the chart is built PER OBJECT: every object becomes its own series. Handy for comparing employees or business lines.
The matrix:
- Code / Name — a graph from the Graphs register (the name fills in by itself and becomes the series name; a row without a name is not drawn);
- Coefficient — the series multiplier: 0.001 shows the sums in thousands. With the "Expand" tick a row's coefficient multiplies every series;
- Objects — an analytics filter for this row only.
Worth knowing
- The chart lives inside the preset window — there is no separate "report". Build, look, adjust the period, build again; saving the preset stores the parameters, not the picture.
- Graphs count turnovers — it is a chart of flow, not of balances: the balance at the start of the period is not added. Monthly and Annual show each axis step's turnover, while Daily shows a running total of turnovers from the start of the period. When the preset's graphs start moving on different days, the Daily running total may go wrong: another graph's series drops off the axis on the first movement day of one of them and restarts from zero after it.
- One preset may mix indicators from different areas: sales, cash, payroll — anything expressible in accounts.
Common situations
Pressed "Build" — an empty chart. Most often the period misses the data: demo activity lives in 2026, while a new preset is created with the current month. Check "From date"/"Date to".
The columns merge into an unreadable mess. Increase the step: a daily period over a year gives hundreds of columns. Monthly is the usual detail for a year.
Want to see each employee's contribution. The "Expand" tick plus an object-type filter in the graph itself: every object becomes a separate chart series.