Graphs
The number builder behind the KPI charts. A graph (key indicator) is a rule for "what to count": which accounts, which side of the posting, with which sign. "Income" = credit turnovers of class-7 accounts; "Expenses" = debit turnovers of class 9. A graph draws nothing by itself — you plug it into a graph preset, and there the numbers become a chart by day, month or year.
Where to find it: Modules → Nominal Ledger → Registers → Graphs
Walkthrough
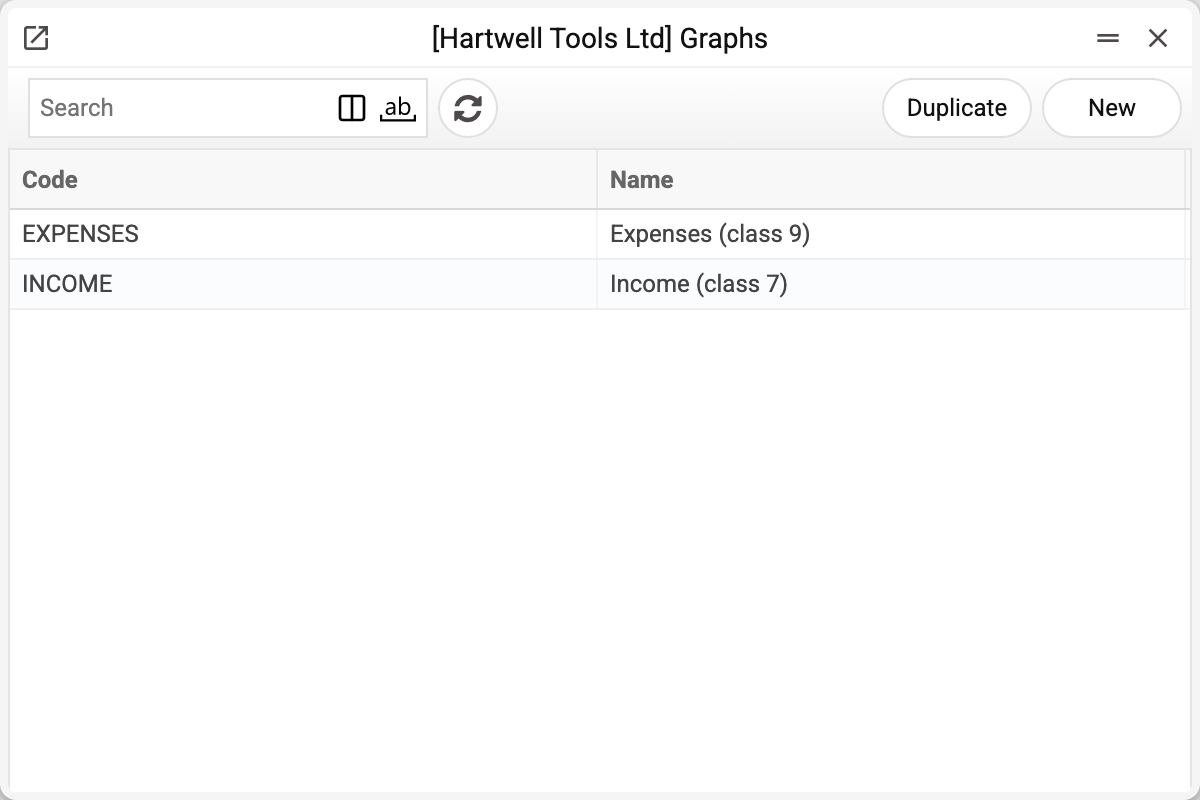
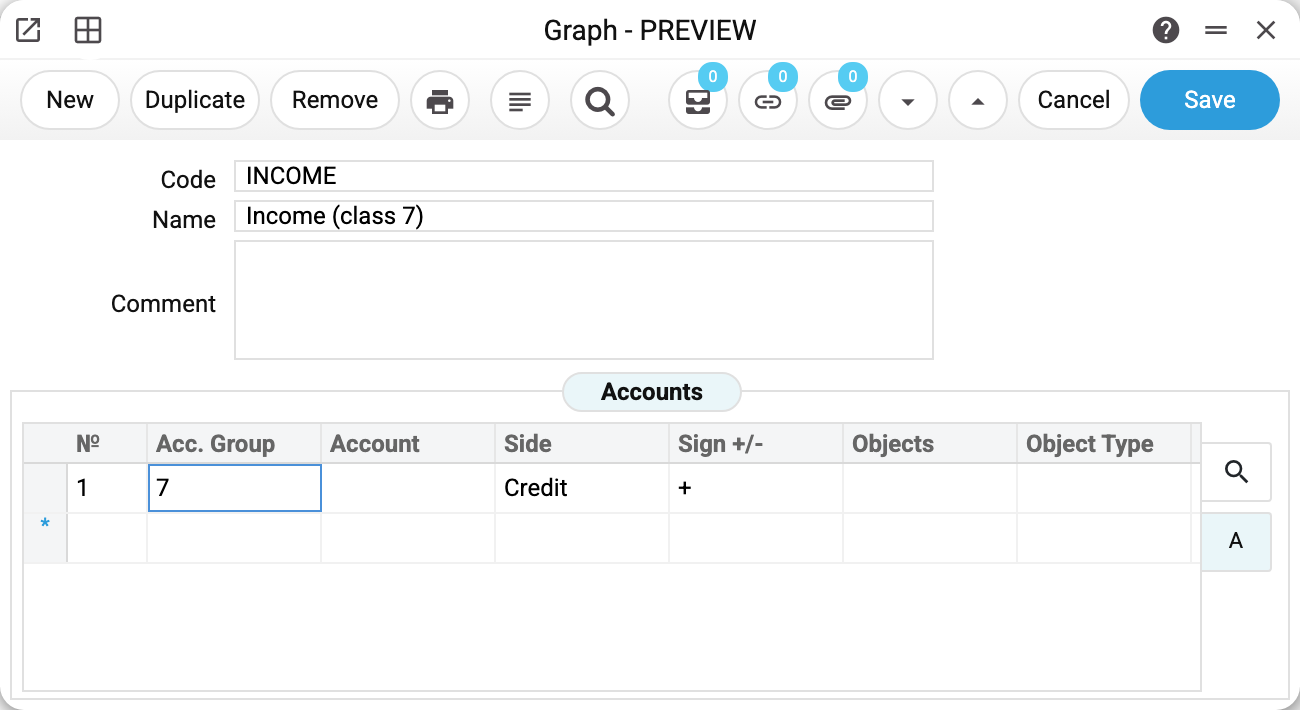
The demo's INCOME graph: a code, the name "Income (class 7)" and the "Accounts" matrix with a single row — account group 7, side "Credit", sign "+". Read it as: take every account whose card carries class 7 and, for each period, sum its credit turnover. The neighbouring EXPENSES graph mirrors it: class 9, side "Debit".
Matrix columns:
- Account Classification — a whole class from Account Classifications: the graph will pick up accounts added later, automatically;
- Account — a specific account from the chart; fill either the group or the account in a row, not both;
- Side — "Debit", "Credit" or "Both" (debit minus credit);
- Sign +/- — add or subtract this row from the graph total;
- Objects and Object Type — an optional analytics filter: count only postings tagged with those objects. It works that way while the graph preset sets no objects — neither in the graph's row nor in the "Object" field: an object set there does not narrow the row filter but is added to it, and a posting needs to match any one of them. A row takes one of the two: the system will not save both. An object type means every object of that type. The filter is reliable while a posting matches a single row of the graph. If an account appears both as a row of its own and inside a class from another row, postings to that account use the account row's filter — and land in both rows. So set objects in a graph whose account rows do not overlap.
Combining rows
A matrix may hold several rows, summed with their signs. The classic recipes:
- Revenue: class 7, Credit, "+" — as in the demo;
- Net result: "class 7, Credit, +" plus "class 9, Debit, −" — income minus expenses in one indicator;
- One channel's sales: account 702, Credit, "+", object WHOLESALE — revenue of the wholesale line only.
The "Both" side computes debit minus credit of the row — handy where the net flow matters rather than one side.
Worth knowing
- A graph counts turnovers, not balances. By month and by year a chart point is the sum of postings of its month or year; "Monthly" takes the whole calendar years the period falls in, and "Annual" takes every year that has postings. By day it is a running total from the start of the chosen period: 100 on the first day and 50 on the second give points 100 and 150, and the last point equals the turnover of the whole period.
- A row with two objects of the same type is rejected — same as in transactions; objects of different types may be listed via comma.
- A graph that sits in a preset cannot be deleted: «A record of «Graphs» is used in: Graph Preset!» Deleted, it would drop out of the chart, and the preset itself could no longer be saved. Remove the row from the preset first — then the graph deletes.
Common situations
Created a graph, there is no chart anywhere. By design: this register holds only the counting rules. The drawing happens in Graph Preset — create a set there and add the graph to its matrix.
The graph's numbers do not match the trial balance. Check the side: "Credit" for class 7 is the raw credit turnover, not netted against debit. Want the net — use "Both".
A new account 703 is not counted. If the graph is defined by class — check the "Class" field of the account card; if by an account list — add a row with 703.