Financial Report Builder
Prints a financial report from the Report Definition you pick: a P&L, a management balance sheet, currency comparisons — you design the form, the builder only does the maths. It will not run without a definition — that is what separates it from the fixed Financial Result form, where the accounts are hard-wired.
Where to find it: Modules → Nominal Ledger → Reports → Financial Report Builder
Every report has two amount columns: the main period and a comparison — what to compare against is a radio switch.
Worked example
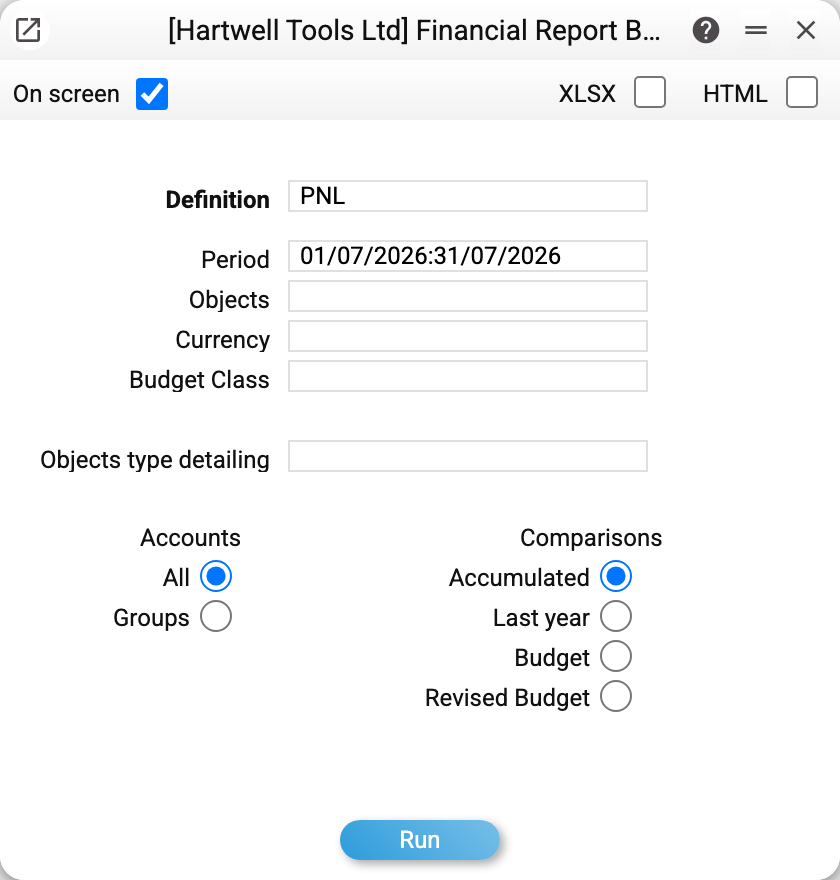
Running the demo PNL definition for July 2026:
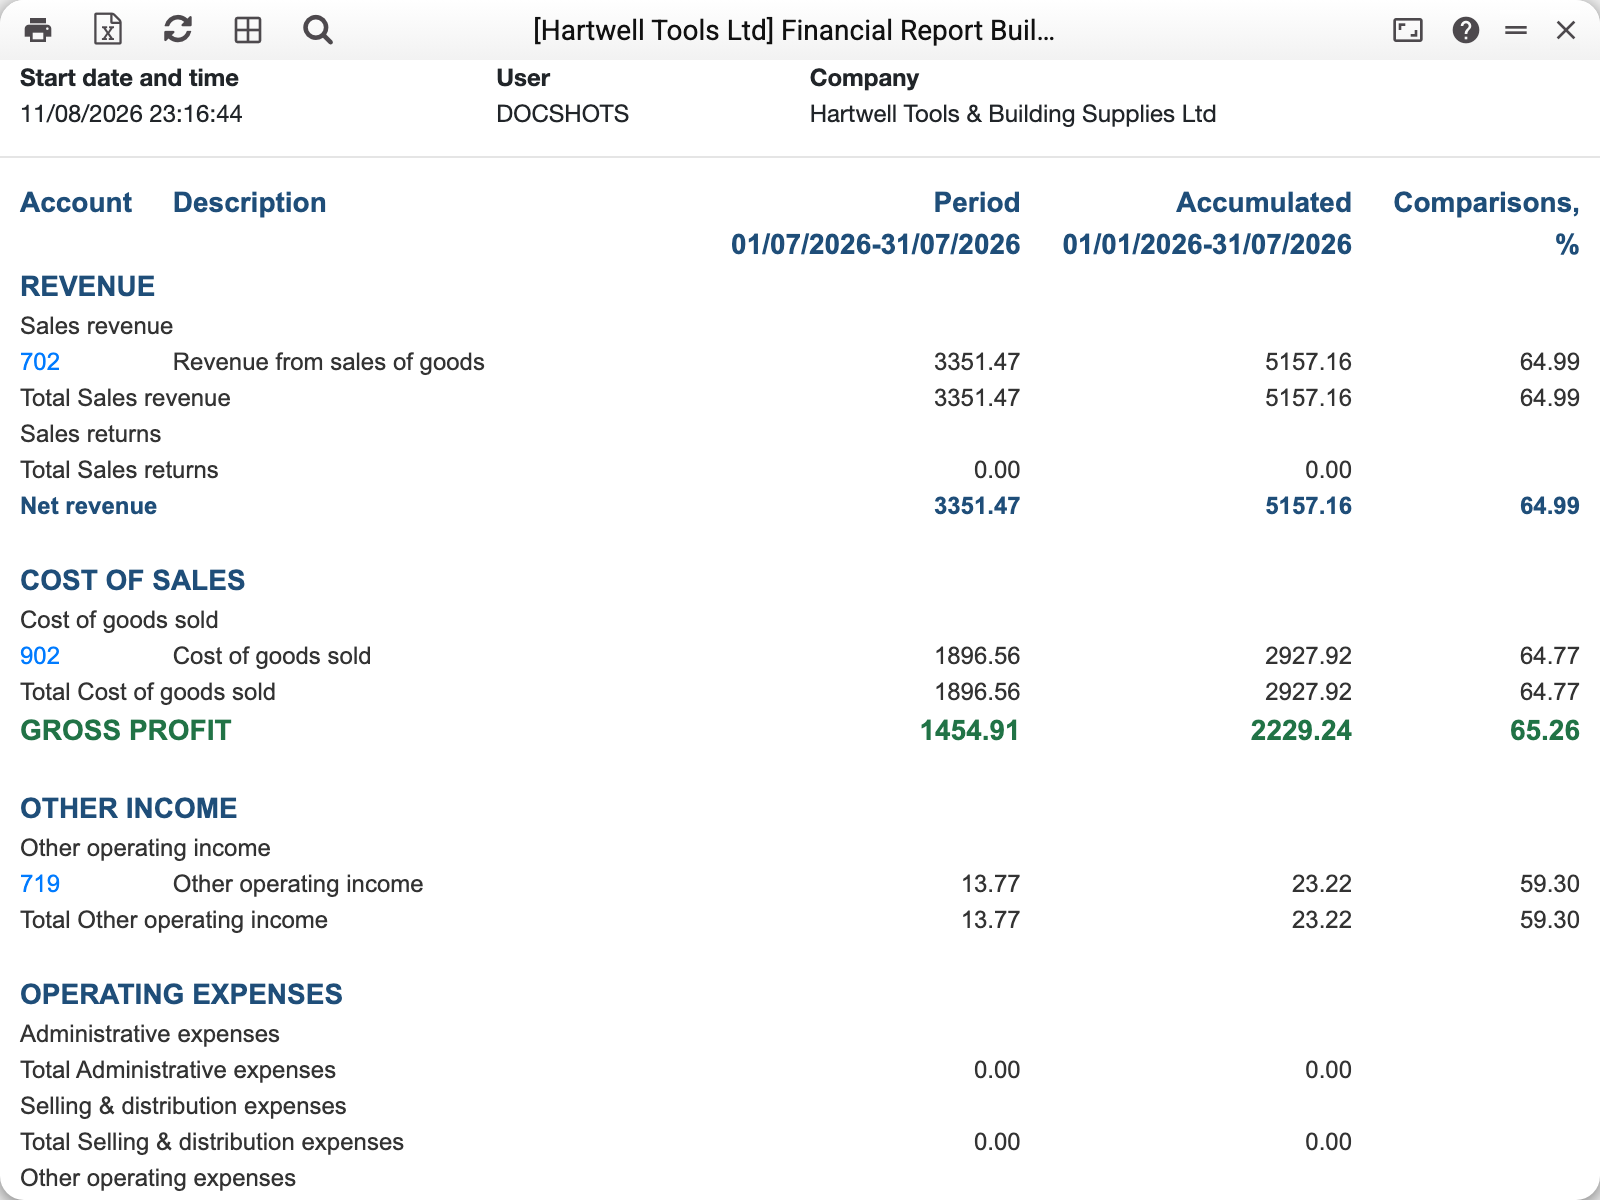
- Sales revenue — 3,351.47 for July and 5,157.16 in the comparison column: the switch is on "Accumulated", so the second column is the same report from January 1 to the period end.
- Cost of goods sold 1,896.56 → GROSS PROFIT 1,454.91 — the sum row
040-060, calculated from the rows above. - At the bottom, NET PROFIT FOR THE PERIOD — 1,427.75 for the month and 2,200.73 year-to-date.
Each row is expanded down to the accounts it was built from ("Accounts: All"); the "Groups" switch keeps only row totals — the compact version for an owner.
Where the data comes from
Account rows read postings (the Transactions register) for the period — all of them, whatever document produced them: invoices, cash desk, work sheets, manual entries. A definition row with the "Balance" flag shows balances instead of turnover: the "At the beginning of the period" column — as at the first date of the period, the "At the end of the period" column — as at the period end date, in any comparison mode ("Last year" and the budget modes included). For the other rows, in the budget comparison modes the second column reads the Budgets/Revised Budgets registers by class. Documents that produced no postings (drafts, non-OK) never enter the report — no posting, no amount.
Parameters
| Parameter | What it does |
|---|---|
| Definition | Which Report Definition to print. Required |
| Period | The main report period |
| Objects | Restrict transactions to a comma-separated list of objects |
| Currency | Count only transactions in this currency |
| Budget class | Which budget feeds the comparison column (for the budget modes) |
| Objects type detailing | Break account amounts down by objects of the given type |
| Accounts: All / Groups | Show every account of a row, or the row total only |
| Comparisons | What goes into the second column (below) |
Comparison modes:
- Accumulated — from January 1 of the year to the period end (year-to-date);
- Last year — the same period one year earlier;
- Budget / Revised budget — planned amounts from Budgets or Revised Budgets for the same period. The "Comparisons, %" column is the main period as a percentage of the comparison column in any mode; against a budget it is the plan completion percentage. For a "Balance" row the third column is headed "Comparisons" without the percent and shows the change of the balance: end minus beginning.
Budget comparison in action — the year 2026 against the annual plan:
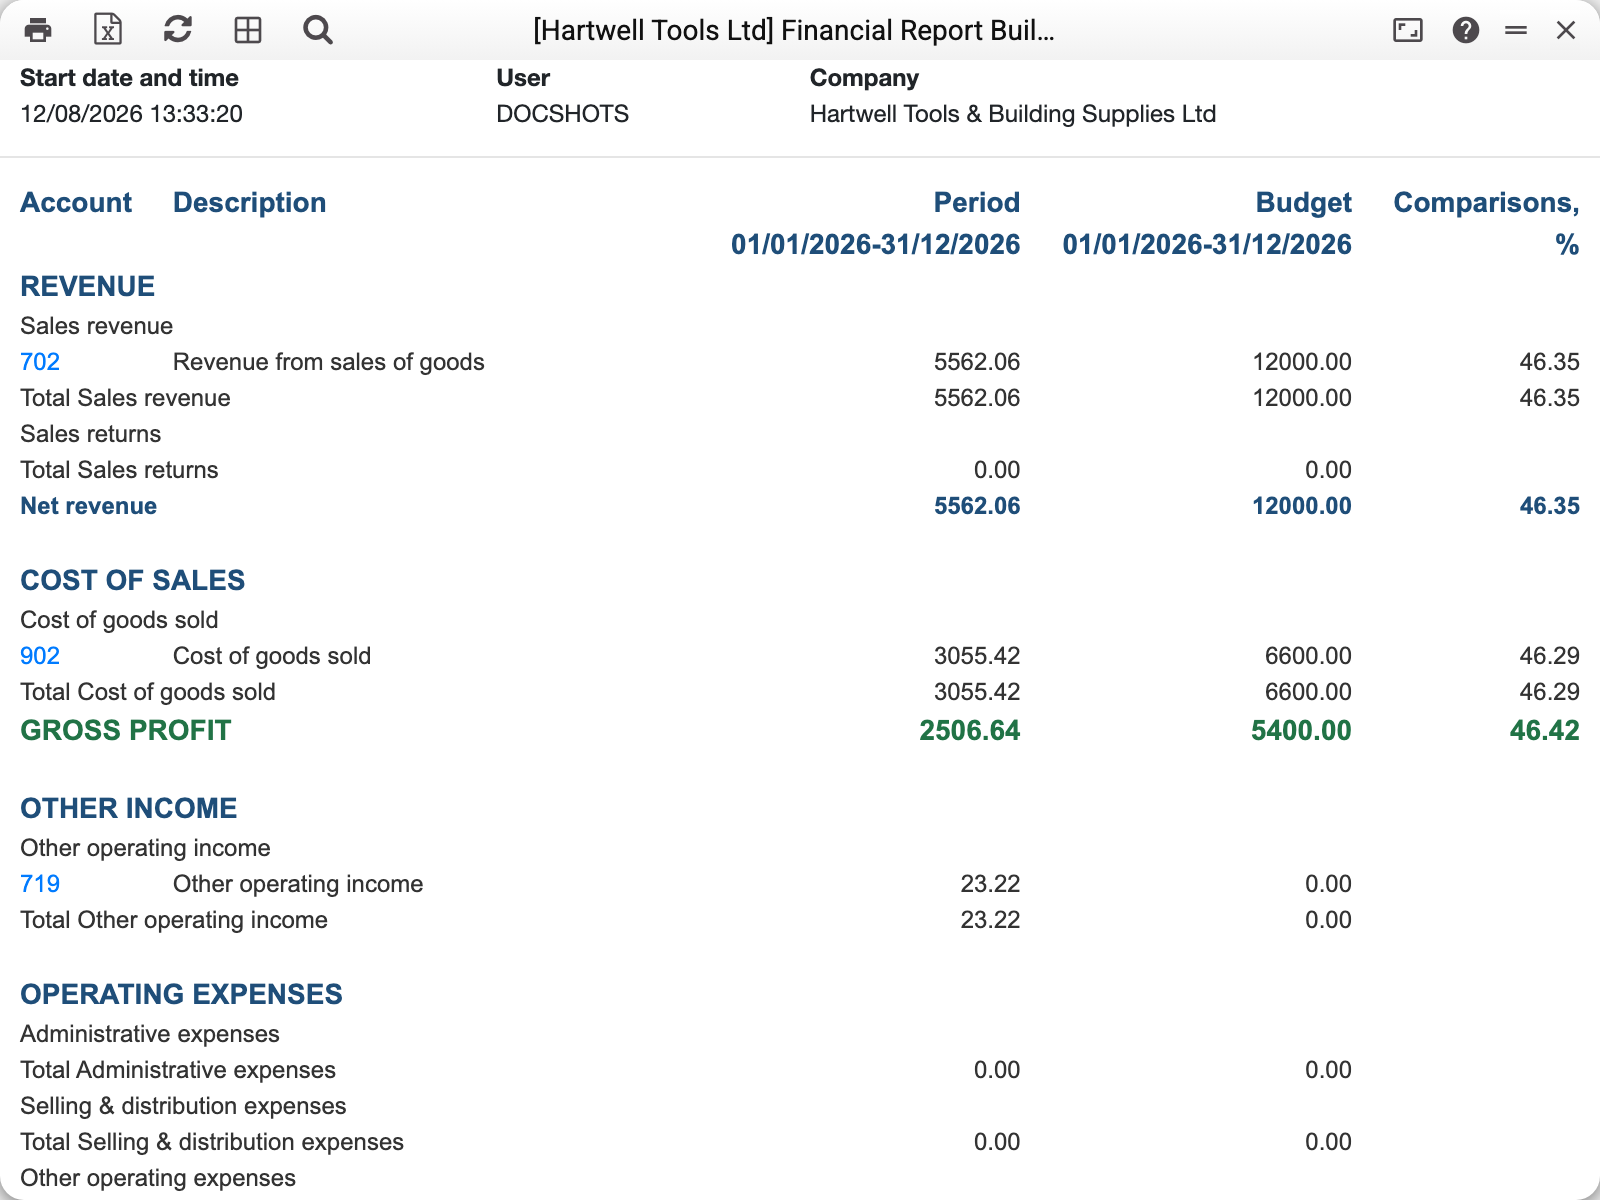
Revenue 702: actual 5,562.06 against a 12,000 plan — 46.35% complete. What it takes to fill the budget column is covered in the Budgets article.
Common situations
"Select definition". The Definition field is empty — the builder has no built-in form; pick or create a definition first.
Both columns are identical. The period starts on January 1, so "Accumulated" coincides with the main period. Not a bug — comparing a month against the year-to-date is simply more useful than comparing a year with itself.
Zeros everywhere. Usually a currency filter that matches no transactions, or a period with no activity.
A sum row is smaller than expected. Look into the definition: the formula may reference a row code that no longer exists — the builder silently skips unknown codes. A sum row with a higher code is skipped the same way: sums are computed in code order, and at that moment it does not exist yet.